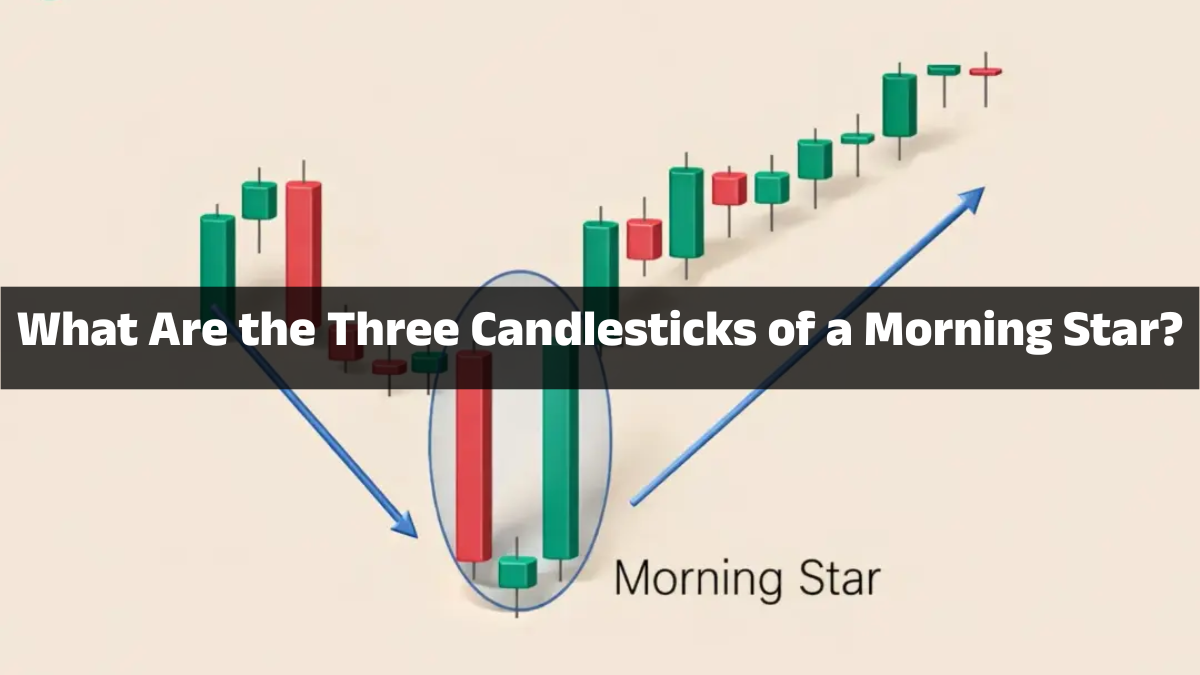
The Morning Star is one of the best-known bullish reversal candlestick patterns in technical analysis. It appears after a sustained downtrend and signals that selling pressure may be fading while buyers are beginning to regain control. Although no candlestick pattern guarantees future price movement, the Morning Star has remained popular among traders because it visually captures a shift in market sentiment. According to recent educational resources from major trading platforms, the pattern consists of three distinct candlesticks and is used across stocks, forex, commodities, and cryptocurrencies.
The pattern represents a battle between sellers and buyers. Imagine a tug-of-war where one team dominates early, then both sides briefly reach a stalemate, and finally the other team pulls decisively to victory. That sequence is exactly what the Morning Star illustrates. Professional traders rarely rely on it alone—they usually combine it with indicators such as RSI, MACD, moving averages, support levels, and trading volume before making a decision. This combination improves the quality of trading signals while reducing the likelihood of false reversals.
Understanding the Morning Star Pattern
The Morning Star is classified as a three-candle bullish reversal pattern. It typically forms at the bottom of a downward price trend and suggests that bearish momentum is weakening. The name comes from the “morning star” seen in the sky just before sunrise, symbolizing hope and the beginning of a new day. Similarly, in financial markets, the pattern symbolizes the possible beginning of a new upward trend.
Technical analysts value this formation because it reflects a gradual change in market psychology instead of an abrupt reversal. Instead of one dramatic bullish candle, the Morning Star develops over three trading periods, allowing traders to observe the transition from fear to uncertainty and finally to optimism. This progression makes the pattern easier to understand and often more reliable than many single-candle reversal signals, especially when it forms near major support levels.
The Three Candlesticks Explained
First Candlestick – Strong Bearish Candle
The first candlestick is a long bearish candle, usually red or black depending on the chart’s color settings. It reflects strong selling pressure and confirms that the market is already in a clear downtrend. Sellers remain confident, pushing prices significantly lower before the trading session closes.
This candle is important because it establishes the existing bearish momentum. Without a preceding downtrend, the Morning Star loses much of its significance. Think of this first candle as the final burst of strength from the bears before they begin to tire. Investors are generally pessimistic, negative news may dominate headlines, and many traders believe prices will continue falling. This emotional backdrop sets the stage for the potential reversal that follows.
Second Candlestick – Small-Bodied Star
The second candlestick is the heart of the Morning Star pattern. It has a small real body, which may be bullish, bearish, or even a Doji. The small body represents market indecision. Neither buyers nor sellers manage to take clear control during this trading period.
This candle acts like a pause after heavy selling. Momentum slows noticeably, suggesting that bearish conviction is weakening. In markets where price gaps occur, this candle often gaps lower than the first candle. In continuous markets such as forex, the gap may not be visible, but the small body still communicates hesitation. Traders interpret this candle as evidence that the previous trend is losing strength and that a potential turning point may be approaching.
Third Candlestick – Strong Bullish Candle
The third candlestick is a large bullish candle that closes well into the body of the first bearish candle—many traders prefer it to close above the midpoint of that first candle. This strong upward movement confirms that buyers have stepped into the market with enough force to overwhelm sellers.
This final candle provides confirmation rather than merely hope. It transforms the pattern from simple indecision into an actionable bullish reversal signal. Ideally, the candle is supported by increased trading volume, indicating broad market participation rather than isolated buying. When this candle appears after the first two stages, many technical traders begin looking for buying opportunities while carefully managing their risk.
The Psychology Behind the Pattern
Understanding the psychology behind the Morning Star is often more valuable than memorizing its shape. The first candle tells us that fear dominates the market. Sellers continue liquidating positions, believing prices will keep falling. Confidence among buyers is extremely low, and bearish momentum appears unstoppable.
The second candle introduces uncertainty. Sellers can no longer push prices aggressively lower, while buyers quietly begin entering the market. Neither side gains a decisive advantage. This equilibrium signals that the previous trend may be running out of energy.
The third candle completes the emotional transition. Buyers suddenly gain confidence and push prices sharply higher. Traders who sold near the lows may begin covering their positions, adding even more buying pressure. This shift from pessimism to optimism explains why the Morning Star often precedes meaningful trend reversals, particularly after extended declines.
How to Identify a Valid Morning Star
A valid Morning Star requires more than simply spotting three candles. The pattern should appear after a clear downtrend, not during sideways price movement. Trend context is critical because reversal patterns only carry meaning when there is an existing trend to reverse.
Experienced traders also look for several confirming factors:
| Confirmation Factor | Why It Matters |
|---|---|
| Strong prior downtrend | Shows genuine bearish momentum |
| Small second candle | Indicates indecision |
| Large bullish third candle | Confirms buyer strength |
| Higher trading volume | Adds credibility to the reversal |
| Nearby support level | Improves probability of success |
| RSI oversold reading | Suggests sellers may be exhausted |
No confirmation factor guarantees success, but the combination significantly improves the quality of potential trade setups. Most professional traders avoid entering solely because they recognize the visual pattern.
How Traders Use the Pattern
Many traders wait until the third candle closes before entering a trade. This helps avoid acting on incomplete formations that may disappear before the trading session ends. Some conservative traders even wait for the following candle to continue moving higher before opening a position.
Risk management is equally important. A common strategy places the stop-loss just below the lowest point of the Morning Star formation. This allows traders to exit quickly if the reversal fails. Profit targets vary depending on the broader trend, nearby resistance levels, or a predetermined risk-to-reward ratio such as 1:2 or 1:3.
The Morning Star works across multiple timeframes, from intraday charts to weekly charts. However, patterns on higher timeframes generally carry greater significance because they represent stronger shifts in market sentiment. Traders also combine the formation with moving averages, Fibonacci retracement levels, and momentum indicators for additional confirmation.
Common Mistakes to Avoid
One of the biggest mistakes beginners make is identifying every group of three candles as a Morning Star. Without a preceding downtrend, the pattern loses much of its predictive value. Trading it during sideways markets often leads to disappointing results.
Another common error is ignoring confirmation. Even textbook-looking patterns sometimes fail because financial markets are influenced by news events, earnings announcements, economic data, and unexpected shifts in investor sentiment. Entering before the third candle closes also increases the chance of acting on a false signal.
Finally, traders should avoid relying exclusively on candlestick patterns. Successful technical analysis usually combines chart patterns with sound risk management, volume analysis, support and resistance, and broader market context. The Morning Star is best viewed as one piece of a larger trading strategy rather than a guaranteed buy signal.
Morning Star vs. Evening Star
| Feature | Morning Star | Evening Star |
|---|---|---|
| Trend Before Pattern | Downtrend | Uptrend |
| Signal | Bullish reversal | Bearish reversal |
| First Candle | Large bearish | Large bullish |
| Second Candle | Small-bodied candle | Small-bodied candle |
| Third Candle | Large bullish | Large bearish |
| Expected Outcome | Price may rise | Price may fall |
The Evening Star is essentially the opposite of the Morning Star. While the Morning Star signals that buyers may be taking control after a decline, the Evening Star warns that sellers may be gaining strength after an uptrend. Together, these two patterns are among the most widely recognized three-candlestick reversal formations in technical analysis.
Conclusion
The three candlesticks of a Morning Star are:
- A large bearish candlestick showing strong selling pressure.
- A small-bodied candlestick representing market indecision.
- A large bullish candlestick confirming that buyers have taken control.
When these three candles appear after a sustained downtrend and are supported by factors such as strong volume, nearby support, or momentum indicators, they can provide a valuable clue that market sentiment is shifting. Even so, no candlestick pattern is infallible. The most successful traders treat the Morning Star as a confirmation tool within a broader trading plan that emphasizes disciplined risk management and multiple forms of analysis.
FAQs
1. Is the Morning Star always bullish?
No. It is a bullish reversal signal, not a guarantee. Confirmation through volume, trend analysis, or technical indicators is recommended.
2. Can the second candle be a Doji?
Yes. A Doji is common in Morning Star formations because it clearly represents market indecision. (Axi)
3. Which markets use the Morning Star pattern?
It can be applied to stocks, forex, cryptocurrencies, commodities, indices, and futures on virtually any timeframe.
4. Is the Morning Star reliable?
Its reliability improves when it forms after a strong downtrend and is confirmed by higher trading volume, support levels, or momentum indicators.
5. What is the opposite of a Morning Star?
The opposite pattern is the Evening Star, a bearish reversal formation that appears after an uptrend and may signal the beginning of a price decline.