Every trader eventually comes across the Morning Star candlestick pattern. It appears in nearly every technical analysis book, countless YouTube videos, and almost every trading platform’s pattern recognition tool.
The promise is attractive: after a strong decline, three candles form a recognizable shape that signals buyers are taking control, potentially creating an excellent buying opportunity. But does this classic pattern actually deserve a place in a day trader’s strategy? The answer is more nuanced than a simple yes or no.
Recent trading research continues to show that the Morning Star can be an effective bullish reversal pattern, but only when used in the right market context rather than as a standalone signal. Several recent analyses report that properly identified Morning Star patterns occurring at significant support levels and confirmed by volume perform substantially better than random entries.
One large study cited by trading educators found reversal success rates approaching 78% under favorable conditions, although that figure drops considerably when traders ignore trend, support, or volume confirmation.
This article explores whether the Morning Star is actually good for day trading, where it performs best, how professional traders use it, its limitations, and how you can incorporate it into a disciplined trading strategy instead of relying on candlestick patterns alone.
Understanding the Morning Star Pattern
The Three-Candle Structure
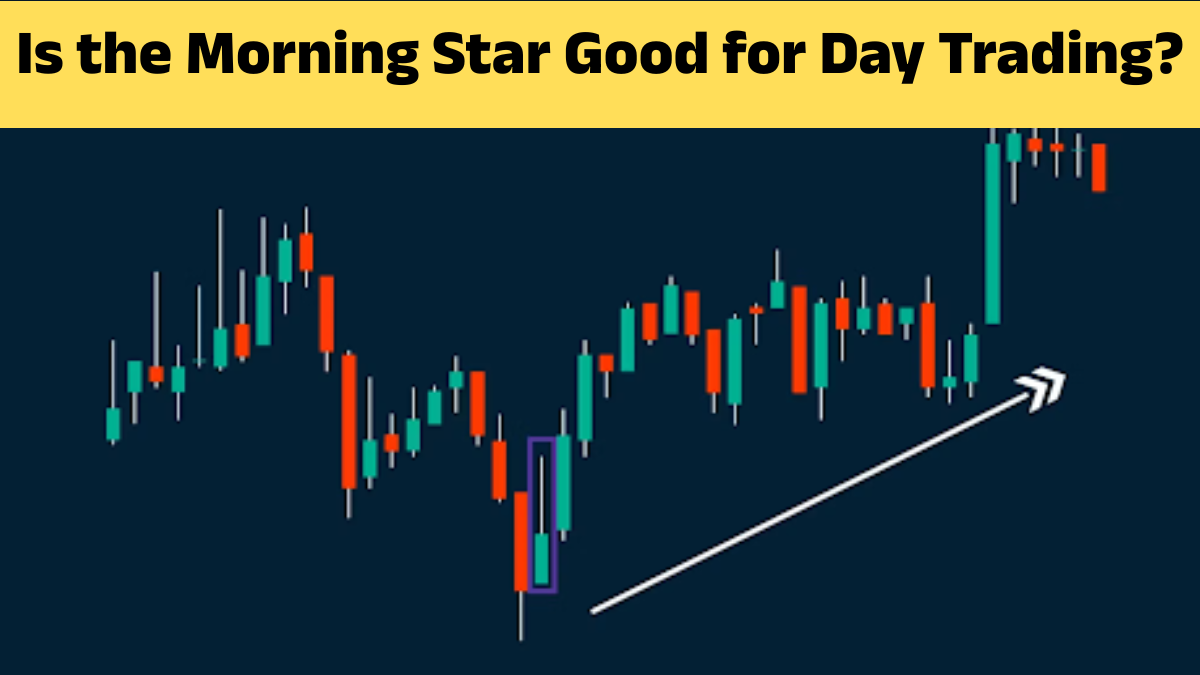
The Morning Star consists of three distinct candlesticks. The first is a strong bearish candle showing sellers firmly in control. The second is a relatively small-bodied candle that represents hesitation or indecision. The final candle is a strong bullish candle that closes well into the body of the first candle, demonstrating that buyers have regained control.
The beauty of this formation lies in the psychology behind it rather than the shape itself. Imagine a tug-of-war where one team dominates early before momentum suddenly shifts. The second candle reflects the moment when neither side has complete control. The third candle confirms that buyers have successfully reversed the previous selling pressure.
Although textbooks often describe perfect versions with price gaps, today’s electronic markets—especially forex, cryptocurrencies, and intraday stock trading—rarely produce textbook gaps. Modern traders therefore focus more on the strength of the third candle, trading volume, and nearby support levels than on achieving perfect textbook geometry.
Why It Signals a Bullish Reversal
Markets move because of changing supply and demand. The Morning Star visually captures that transition.
The first bearish candle attracts aggressive sellers. The second candle shows those sellers beginning to lose conviction while buyers cautiously enter the market. By the third candle, buyers overwhelm remaining sellers, creating a decisive upward move.
This transition explains why experienced traders rarely trade the pattern by itself. Instead, they ask questions such as:
| Question | Why It Matters |
|---|---|
| Is the pattern forming at major support? | Support increases reversal probability. |
| Is volume increasing? | Higher volume confirms buyer participation. |
| Is the overall trend still healthy? | Higher-timeframe trends influence success. |
| Is there nearby resistance? | Resistance may limit upside potential. |
The stronger these supporting factors become, the more meaningful the Morning Star tends to be.
Does the Morning Star Really Work?
Recent Research and Statistics
The Morning Star has been studied extensively through historical market data. Recent large-scale testing involving millions of candlesticks suggests the pattern can achieve relatively high reversal accuracy when combined with context, particularly major support zones, established downtrends, and increased buying volume. One widely referenced study reports reversal rates close to 78% under those favorable conditions.
Other independent testing paints a more balanced picture. Historical studies on S&P 500 stocks found Morning Stars relatively uncommon—appearing in less than one-third of one percent of daily candles—but showing above-average performance compared with many other candlestick formations over multi-candle holding periods.
At the same time, broader quantitative research and independent backtests caution against expecting any candlestick pattern to produce a lasting edge on its own. Several recent analyses found that many classic candlestick patterns perform little better than market baseline probabilities unless combined with additional filters such as market structure, volatility, or volume.
Expert Opinions
Candlestick expert Steve Nison, who introduced Japanese candlestick techniques to many Western traders, has consistently emphasized that candlestick formations should be interpreted within broader market context rather than traded mechanically.
Current educational material from brokers and trading educators echoes that principle. Modern trading guides repeatedly recommend confirming Morning Star setups with trend analysis, support and resistance, moving averages, or momentum indicators before entering trades.
The consensus among professionals is surprisingly consistent:
- The Morning Star is useful.
- It is not sufficient by itself.
- Context creates the edge.
How Day Traders Use the Morning Star
Best Timeframes
1-Minute vs 5-Minute vs 15-Minute Charts
Although Morning Stars can appear on every timeframe, reliability generally improves as the timeframe increases.
The 1-minute chart produces many patterns but also generates significant market noise. Many of these signals fail because they simply reflect random price fluctuations rather than genuine changes in supply and demand.
The 5-minute chart strikes a balance between responsiveness and reliability, making it one of the most popular choices for active day traders.
The 15-minute chart often produces fewer but higher-quality signals. Institutional participation becomes more visible, reducing random fluctuations and making successful reversals easier to identify.
Ideal Market Conditions
Morning Stars perform best when several favorable conditions align:
- Strong preceding decline
- Major support level
- Increasing bullish volume
- Oversold momentum indicators
- Overall market stabilization
When all these elements occur together, traders gain multiple independent reasons to believe a reversal may develop.
Entry, Stop Loss, and Profit Target
A disciplined approach typically includes:
| Component | Common Practice |
|---|---|
| Entry | Above third candle high |
| Stop Loss | Below Morning Star low |
| First Target | Previous resistance |
| Risk-Reward | Minimum 1:2 |
This framework helps remove emotional decision-making while maintaining consistent risk management.
Advantages of Trading the Morning Star
Strengths
The Morning Star offers several advantages that explain its enduring popularity.
First, it provides a clearly defined trading structure. Entry, stop-loss placement, and invalidation levels are visually obvious. This simplicity appeals to both beginners and experienced traders.
Second, it reflects genuine market psychology rather than arbitrary mathematical calculations. Traders can literally observe sellers losing momentum before buyers seize control.
Third, the pattern works across multiple markets, including stocks, forex, futures, commodities, and cryptocurrencies.
Psychological Edge
Successful trading depends as much on discipline as on technical analysis.
Patterns like the Morning Star encourage traders to wait patiently for confirmation instead of chasing rapidly moving prices. Instead of buying during panic selling, traders wait until evidence suggests buyers are returning.
This mindset naturally reduces impulsive trades.
Limitations and False Signals
Common Mistakes
Many traders misuse the Morning Star in predictable ways.
The biggest mistake is treating every Morning Star as an automatic buy signal.
Other frequent errors include:
- Ignoring higher timeframe trends
- Trading during major news events
- Entering before confirmation
- Using excessive leverage
- Ignoring nearby resistance
These mistakes often explain disappointing results more than the pattern itself.
How to Filter Bad Setups
Professional traders typically filter Morning Stars using multiple confirmations.
Popular filters include:
- Support and resistance
- VWAP
- 20 EMA
- Relative Volume
- RSI divergence
- MACD confirmation
Each additional confirmation slightly reduces trade frequency but often improves overall quality.
Comparing the Morning Star With Other Reversal Patterns
Morning Star vs Bullish Engulfing
| Feature | Morning Star | Bullish Engulfing |
|---|---|---|
| Candles | 3 | 2 |
| Confirmation | Higher | Faster |
| Reliability | Generally stronger with confirmation | Faster but more frequent |
| Best Use | Major reversals | Short-term reversals |
The Morning Star develops more slowly, allowing traders additional confirmation before committing capital.
Morning Star vs Hammer
The Hammer forms in a single candle and therefore appears more frequently.
The Morning Star generally offers stronger confirmation because multiple candles demonstrate the transfer of market control.
Many traders combine both patterns rather than choosing one over the other.
Practical Trading Strategy
Step-by-Step Example
Imagine a technology stock falls steadily throughout the morning after disappointing earnings guidance.
Around midday, price reaches a strong support level tested multiple times during previous weeks.
A Morning Star forms:
- Large bearish candle.
- Small indecision candle.
- Strong bullish candle with rising volume.
Instead of buying immediately, the trader waits for price to break above the third candle’s high.
The stop-loss is placed below the Morning Star’s lowest point.
The first profit target becomes the nearest resistance zone, providing a favorable 2:1 reward-to-risk ratio.
If volume continues increasing and the overall market strengthens, part of the position can remain open using a trailing stop.
This disciplined process illustrates why successful traders focus less on recognizing candlestick names and more on combining technical evidence into a complete trading plan.
Conclusion
The Morning Star is good for day trading—but only when used correctly.
It is not a magic signal that guarantees profitable trades. Like every technical pattern, its effectiveness depends heavily on context, confirmation, disciplined execution, and risk management.
Recent research suggests that Morning Stars occurring at significant support levels with strong confirmation can outperform many other candlestick formations. Yet broader quantitative studies remind traders that no candlestick pattern consistently beats the market in isolation.
The most successful day traders use the Morning Star as one piece of evidence within a broader trading framework that includes trend analysis, market structure, volume, volatility, and strict risk management. Viewed that way, it becomes a valuable decision-making tool rather than a shortcut to profits.
FAQs
1. Is the Morning Star reliable for day trading?
Yes, but reliability improves significantly when the pattern forms near strong support and is confirmed by volume, trend analysis, and other technical indicators.
2. Which timeframe works best?
The 5-minute and 15-minute charts generally provide a better balance between trade frequency and reliability than the 1-minute chart.
3. Can beginners trade the Morning Star?
Yes. Its clearly defined structure makes it beginner-friendly, provided traders also learn risk management and avoid relying solely on candlestick patterns.
4. Should I combine the Morning Star with indicators?
Absolutely. Many traders combine it with VWAP, moving averages, RSI, MACD, or support and resistance levels to improve trade quality.
5. Is the Morning Star better than the Bullish Engulfing pattern?
Neither pattern is universally superior. The Morning Star generally provides stronger confirmation, while the Bullish Engulfing pattern often offers earlier entries.