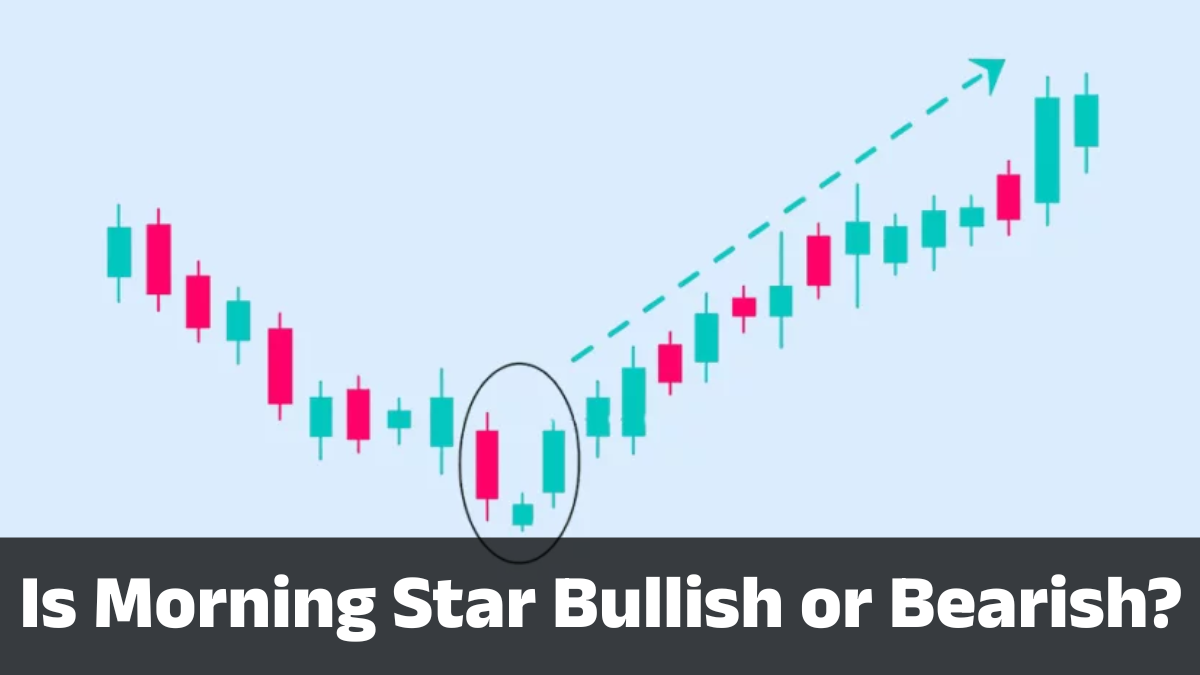
If you’ve ever looked at a candlestick chart and wondered whether the Morning Star is a bullish or bearish pattern, the answer is refreshingly simple: the Morning Star is a bullish reversal candlestick pattern. It appears after a downtrend and suggests that selling pressure is fading while buyers are beginning to take control.
Technical analysis references consistently describe it as one of the most recognized bullish reversal formations, although they also stress that it should be confirmed with other indicators before acting on it.
That said, no candlestick pattern guarantees future price movement. A Morning Star increases the probability of a trend reversal, but it is not a promise that prices will rise. Successful traders combine it with volume, support levels, momentum indicators, and broader market context.
Understanding the Morning Star Candlestick Pattern
The Morning Star is a three-candlestick formation that typically develops after a prolonged decline. Think of it as the market’s version of sunrise after a long night. Sellers dominate during the first candle, uncertainty takes over during the second, and buyers regain confidence during the third candle.
The pattern consists of:
- A long bearish candle.
- A small-bodied candle (which may be a Doji or spinning top) showing indecision.
- A strong bullish candle closing well into the first candle’s body.
This transition represents a gradual shift in market sentiment from pessimism to optimism. Rather than changing instantly, market psychology evolves over these three sessions, making the pattern particularly meaningful to technical traders.
Is the Morning Star Bullish or Bearish?
The answer is bullish.
The Morning Star is classified as a bullish reversal pattern, meaning it suggests that a previous downtrend may be ending and an upward trend could begin. The keyword here is reversal. The pattern is only meaningful when it appears after an established decline. If it forms during sideways movement or an existing uptrend, its significance is greatly reduced.
Many beginners mistakenly assume every bullish pattern is an automatic buy signal. Professional traders know better. A Morning Star is better viewed as evidence that buyers are gaining strength rather than proof that prices will continue climbing.
Anatomy of the Morning Star Pattern
Understanding each candle individually makes the pattern much easier to recognize.
| Candle | Description | Market Psychology |
|---|---|---|
| First | Large bearish candle | Sellers dominate |
| Second | Small-bodied candle or Doji | Indecision between buyers and sellers |
| Third | Strong bullish candle | Buyers regain control |
The first candle confirms the existing downtrend. Bears remain confident and continue pushing prices lower.
The second candle changes the story. Price movement slows dramatically. Whether it’s a Doji, spinning top, or another small candle, the message is similar: momentum is weakening.
The third candle completes the pattern with strong buying pressure. Ideally, it closes above the midpoint of the first candle’s body, providing confirmation that buyers have successfully overwhelmed sellers.
Psychology Behind the Morning Star
Candlestick patterns work because they visualize crowd psychology.
Imagine a tug-of-war.
At first, sellers are winning comfortably. Prices continue falling, and fear spreads throughout the market.
Then something interesting happens. Sellers begin running out of momentum. New sellers hesitate, while bargain hunters quietly start buying. This creates the small middle candle.
Finally, buyers gain confidence. Demand suddenly exceeds supply, resulting in a strong bullish candle. What began as uncertainty transforms into optimism.
This shift in sentiment explains why experienced traders value the Morning Star. Rather than focusing solely on candle shapes, they interpret the emotional battle taking place between bulls and bears.
How to Confirm a Morning Star Signal
A Morning Star becomes much stronger when supported by additional evidence.
Common confirmation methods include:
- Higher trading volume during the third candle.
- Support levels holding successfully.
- RSI moving out of oversold territory.
- MACD showing bullish crossover.
- Break above nearby resistance.
Many technical analysts recommend waiting until the third candle fully closes before entering a trade. Jumping in too early increases the likelihood of false signals.
Morning Star vs. Evening Star
These two patterns are mirror images.
| Feature | Morning Star | Evening Star |
|---|---|---|
| Signal | Bullish reversal | Bearish reversal |
| Appears After | Downtrend | Uptrend |
| Expected Move | Upward | Downward |
| Final Candle | Strong bullish | Strong bearish |
If the Morning Star resembles sunrise signaling a new day, the Evening Star represents sunset, often warning that an uptrend is losing momentum.
Common Trading Mistakes
One of the biggest mistakes traders make is treating every Morning Star as a guaranteed buying opportunity.
Some frequent errors include:
- Ignoring the broader market trend.
- Buying before the third candle closes.
- Forgetting to use stop-loss orders.
- Trading without confirmation from volume or indicators.
- Entering positions in low-liquidity markets.
Community discussions among experienced traders consistently emphasize that context matters more than simply recognizing the pattern. A Morning Star at a major support level is generally more meaningful than one appearing randomly in a range-bound market.
Advantages and Limitations
Like every technical pattern, the Morning Star has strengths and weaknesses.
Advantages
- Easy to recognize.
- Works across stocks, forex, commodities, and cryptocurrencies.
- Appears on multiple timeframes.
- Indicates potential trend reversals early.
- Can be combined with other technical tools.
Limitations
- Not every Morning Star leads to a rally.
- False signals occur during volatile markets.
- Requires confirmation.
- Less reliable without an existing downtrend.
- News events can invalidate technical patterns.
Professional traders rarely rely on candlestick patterns alone. Instead, they treat them as one piece of a larger decision-making framework.
Conclusion
The Morning Star is a bullish candlestick pattern, not a bearish one. It forms after a downtrend and suggests that sellers are losing control while buyers are beginning to dominate. Its three-candle structure reflects a gradual shift in market psychology—from fear to uncertainty and finally to renewed optimism.
While the Morning Star is among the most respected bullish reversal patterns in technical analysis, it should never be used in isolation. Combining it with support and resistance analysis, volume, RSI, MACD, and overall market structure significantly improves its effectiveness. The best traders understand that candlestick patterns indicate probabilities, not certainties, making disciplined risk management just as important as recognizing the pattern itself.
Frequently Asked Questions
1. Is the Morning Star bullish or bearish?
The Morning Star is a bullish reversal candlestick pattern that typically forms after a downtrend.
2. Can a Morning Star fail?
Yes. Like every technical indicator, it can produce false signals, especially without confirmation from volume or other indicators.
3. Which indicators work best with the Morning Star?
RSI, MACD, moving averages, support and resistance levels, and volume analysis are commonly used for confirmation.
4. Does the Morning Star work in cryptocurrency trading?
Yes. The pattern can appear in stocks, forex, commodities, indices, and cryptocurrencies because it reflects market psychology rather than a specific asset class.
5. Is the Morning Star suitable for beginners?
Yes. It is one of the easiest three-candlestick patterns to identify, but beginners should practice using confirmation techniques and proper risk management before trading with real money.