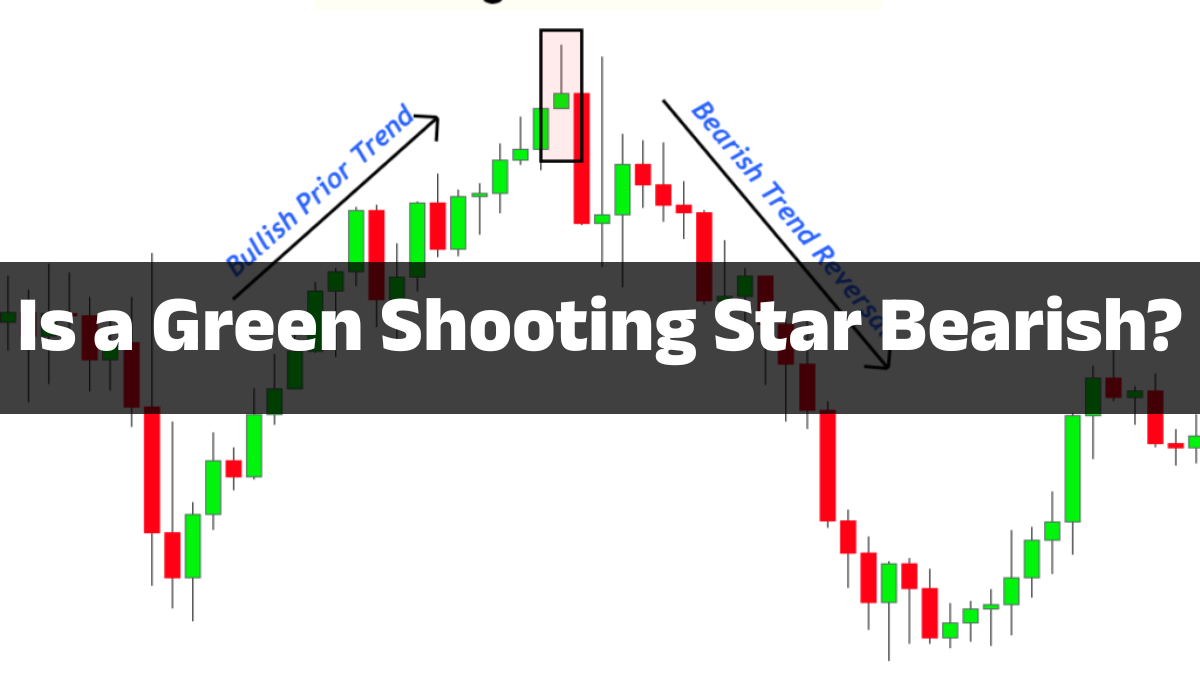
Is a Green Shooting Star Bearish? Many traders hesitate when they encounter a green shooting star candlestick. Traditional trading wisdom often associates green candles with bullish momentum and red candles with bearish sentiment. So, what happens when a candle has the unmistakable shape of a shooting star but closes green? Does it still signal a reversal, or should traders ignore it?
The short answer is yes—a green shooting star is generally considered bearish. The shape and location of the candlestick matter far more than its color. When a green shooting star appears after a sustained uptrend, it often indicates that buyers initially pushed prices significantly higher but lost control before the session ended.
Sellers stepped in aggressively, rejecting those higher prices and leaving behind the characteristic long upper shadow. Technical analysts view this as a warning that bullish momentum may be weakening, although confirmation from subsequent price action is essential before making trading decisions.
Understanding the Shooting Star Candlestick
The shooting star is a single-candle bearish reversal pattern that develops after an established uptrend. It features a small real body near the low of the candle, a long upper wick—typically at least twice the body’s length—and little to no lower shadow. The upper wick represents buyers pushing prices higher during the trading session before sellers overwhelmed them and forced prices back toward the opening level.
This candle alone does not guarantee a reversal. Instead, it serves as an early warning that buying pressure may be fading. Professional traders almost always wait for additional confirmation, such as a bearish candle closing below the shooting star’s low, before entering a short position. The pattern becomes especially meaningful when it appears after a prolonged rally or near a significant resistance level.
Anatomy of the Pattern
A valid shooting star usually includes:
- A small real body
- A long upper shadow at least twice the body length
- Little or no lower shadow
- Formation after a clear uptrend
Although many beginners focus on whether the candle is green or red, experienced traders know that price rejection is the defining characteristic.
Why It Forms
Imagine buyers driving a stock from $100 to $108 during the trading session. Everything appears bullish until sellers suddenly flood the market, pushing the price back down to close around $101. That failed rally leaves a long upper wick—a visual record of rejected higher prices.
Does Candle Color Matter?
One of the biggest misconceptions in technical analysis is that a green shooting star cannot be bearish because it closed above its opening price.
That simply isn’t true.
The shape and context matter far more than the candle’s color. Market technicians consistently describe both green and red shooting stars as bearish reversal candidates when they occur after an uptrend. A red body is generally considered slightly stronger, but a green shooting star remains a valid bearish signal if it demonstrates clear rejection of higher prices.
Green vs. Red Shooting Star
| Feature | Green Shooting Star | Red Shooting Star |
|---|---|---|
| Bearish signal | Yes | Yes |
| Reliability | High | Slightly Higher |
| Indicates rejection | Yes | Yes |
| Needs confirmation | Yes | Yes |
| Best after uptrend | Yes | Yes |
The difference lies in psychology.
A red candle means sellers finished the session stronger than buyers from start to finish.
A green candle means buyers still managed to close above the opening price—but only after giving back most of their gains. That rejection is what traders care about.
Market Psychology Behind the Pattern
Technical analysis works because candlesticks visually display the battle between buyers and sellers.
A green shooting star tells an interesting story.
Early in the trading session, optimism dominates. Buyers continue the existing uptrend, convincing more traders to enter the market. Prices surge upward, often breaking intraday resistance.
Then everything changes.
Institutional traders, profit-takers, or aggressive short sellers begin selling into the rally. Their orders overwhelm demand. Instead of finishing near the highs, price collapses toward the opening level.
That dramatic reversal suggests buyers are losing confidence.
Although bulls technically “won” by closing slightly above the opening price, they lost the far more important battle—they failed to defend higher prices.
When a Green Shooting Star Is Reliable
Not every shooting star deserves attention.
Location determines significance.
After a Strong Uptrend
The strongest shooting stars appear after multiple consecutive bullish candles or an extended upward move. Without an existing uptrend, the pattern loses much of its predictive value because there is no bullish momentum to reverse.
At Major Resistance
Resistance levels often attract institutional selling.
If a green shooting star forms directly beneath:
- Previous swing highs
- Fibonacci resistance
- Weekly resistance
- Psychological price levels
its probability of success generally improves.
High Volume Confirmation
Higher-than-average trading volume suggests the rejection wasn’t random.
Instead, it indicates significant participation by institutional traders, making the signal more meaningful.
Common Mistakes Traders Make
Many beginners lose money because they misunderstand candlestick patterns.
The biggest mistake is entering a short position immediately after spotting a shooting star.
Professional traders wait for confirmation.
A bearish candle closing below the shooting star provides evidence that sellers truly gained control. Trading without confirmation often leads to false signals because many shooting stars fail and the uptrend resumes.
Another common error is ignoring broader market context. During powerful bull markets, a shooting star may result in only a brief pullback rather than a major reversal. Combining candlestick analysis with support and resistance, trendlines, moving averages, RSI, or MACD typically produces better decision-making than relying on a single candle.
Trading Strategies
Conservative Strategy
Most experienced traders follow a disciplined approach:
- Wait for the shooting star to form.
- Wait for the next candle to close bearishly.
- Enter below the shooting star’s low.
- Place a stop-loss above the upper wick.
- Target the next support level or use a favorable risk-to-reward ratio.
This approach reduces the number of false entries.
Aggressive Strategy
Some traders enter immediately after the shooting star closes.
While this offers earlier entries and potentially larger profits, it also exposes traders to a higher probability of failed reversals.
Unless supported by strong volume and major resistance, aggressive entries generally carry greater risk.
Practical Example
Imagine a stock rallies from $80 to $110 over several weeks.
On Monday:
- Opens at $109
- Rallies to $116
- Falls sharply
- Closes at $110
The candle finishes green because it closed above the opening price.
Yet almost the entire rally from $110 to $116 was rejected.
The next day the stock closes below Monday’s low.
Many traders would interpret this sequence as confirmation that sellers have taken control.
Comparison Table
| Factor | Strong Signal | Weak Signal |
|---|---|---|
| Prior trend | Strong uptrend | Sideways market |
| Upper wick | Very long | Short |
| Body | Small | Large |
| Resistance nearby | Yes | No |
| Volume | Above average | Low |
| Confirmation candle | Present | Missing |
| Overall reliability | High | Low |
Expert Perspective
Candlestick experts consistently emphasize that confirmation is more important than color.
Research cited by several educational trading resources also indicates that requiring a confirmation candle improves reliability compared with acting on the shooting star alone. Some backtesting studies have reported improved success rates when traders combine the pattern with resistance levels and confirmation, though results naturally vary across markets, timeframes, and trading methods.
This reinforces a key principle of technical analysis: no single candlestick guarantees future price movement.
Conclusion
A green shooting star is indeed bearish, despite closing above its opening price. The defining features of the pattern are its long upper shadow, small real body, and appearance after an uptrend. These characteristics reveal that buyers attempted to push prices significantly higher but failed to maintain control as sellers forced prices back down before the close.
While a red shooting star is generally viewed as slightly stronger, the difference is relatively small compared with the importance of context, trend, resistance, trading volume, and confirmation from subsequent candles.
Successful traders rarely make decisions based on a single candlestick. Instead, they combine shooting stars with broader market structure, support and resistance, trend analysis, and disciplined risk management. When interpreted within the right context, a green shooting star can be a valuable early warning of weakening bullish momentum and a potential bearish reversal.
FAQs
1. Is a green shooting star always bearish?
No. It is a potential bearish reversal signal, not a guarantee. Confirmation from later price action is recommended.
2. Is a red shooting star stronger than a green one?
Yes. A red shooting star is generally considered slightly more bearish, but both patterns are valid when they appear after an uptrend.
3. What confirms a shooting star?
A bearish candle closing below the shooting star’s low is one of the most common confirmation signals.
4. Can a green shooting star fail?
Absolutely. Like every technical pattern, it can produce false signals, particularly during strong bullish trends or when it forms without resistance or follow-through.
5. Should beginners trade solely based on a shooting star?
No. It is better to combine the pattern with trend analysis, support and resistance, volume, and sound risk management rather than relying on a single candlestick.