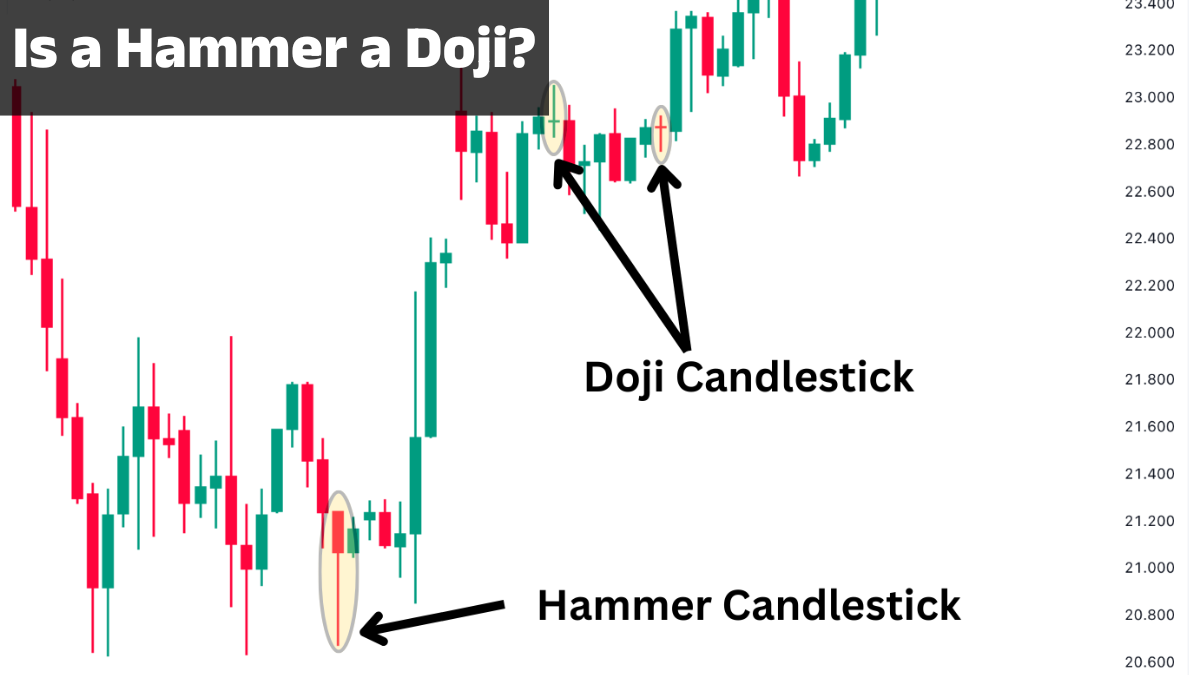
If you’ve just started learning candlestick chart patterns, you’ve probably asked yourself: “Is a hammer a doji?” It’s an excellent question because these two patterns often look similar at first glance. Both can have small bodies and long shadows, and both can appear around important market turning points. Yet they are not the same pattern, and confusing them can lead to poor trading decisions.
Technical analysts distinguish a hammer from a doji based primarily on the relationship between the candle’s opening and closing prices. A hammer has a small real body positioned near the top of the candle with a long lower shadow, while a doji has virtually no real body because the opening and closing prices are nearly identical. Their market psychology also differs: a hammer suggests bullish rejection of lower prices, whereas a doji generally signals market indecision.
Understanding Candlestick Patterns
Candlestick charts have been used for centuries because they display far more information than a simple line chart. Every candle tells a story about the struggle between buyers and sellers during a specific period. The body reveals where the market opened and closed, while the shadows—or wicks—show how far prices traveled before reversing. This makes candlesticks one of the most widely used tools in technical analysis.
Rather than memorizing dozens of patterns, experienced traders focus on understanding the psychology behind price movement. A candle isn’t merely a shape; it reflects real buying and selling pressure. That’s why the same-looking candle can have completely different meanings depending on where it appears within a trend.
What Is a Hammer Candlestick?
A hammer is a bullish reversal candlestick that usually forms after a sustained decline. Its defining characteristics include:
- Small real body near the top
- Long lower shadow that is generally at least twice the body’s length
- Little or no upper shadow
This structure shows that sellers initially drove prices sharply lower during the session. Later, buyers stepped in aggressively and pushed prices back toward the opening level before the candle closed.
The hammer doesn’t guarantee a reversal. Instead, it suggests that buyers have started challenging the prevailing bearish momentum. Traders usually wait for a bullish confirmation candle before entering a trade.
What Is a Doji Candlestick?
A doji forms when the opening and closing prices are nearly identical, resulting in a candle with almost no real body.
Unlike the hammer, the doji doesn’t automatically indicate bullish or bearish sentiment. Instead, it represents indecision. Buyers and sellers fought throughout the session, but neither side managed to gain lasting control.
Different types of doji include:
Dragonfly Doji
The Dragonfly Doji has a long lower shadow and almost no upper shadow. It resembles a hammer but has virtually no real body. This subtle structural difference is why many beginners confuse the two.
Gravestone Doji
The Gravestone Doji features a long upper shadow with almost no lower shadow. It often appears near market tops and may signal weakening buying pressure.
Is a Hammer a Doji?
No. A hammer is not a doji.
Although they can appear similar, they are classified differently because their structures communicate different market behavior.
A hammer requires a visible real body. Even if that body is small, it demonstrates that buyers managed to finish the session above or below the opening price.
A doji, meanwhile, forms because the opening and closing prices are almost identical. This lack of body indicates balance rather than dominance.
The confusion becomes understandable when looking at a Dragonfly Doji, which resembles a hammer with an almost invisible body. Some analysts even refer to this variation as a Hammer Doji or Dragonfly Doji, but technically it still belongs to the doji family, not the hammer family.
Major Differences
| Feature | Hammer | Doji |
|---|---|---|
| Real body | Small but visible | Nearly nonexistent |
| Primary meaning | Bullish reversal | Market indecision |
| Trend location | Usually after downtrend | Any trend |
| Lower shadow | Long | Can vary |
| Upper shadow | Small or absent | Variable |
| Confirmation needed | Yes | Yes |
Similarities Between Hammer and Doji
Both are single-candle formations that attract traders searching for potential market turning points. Neither should be traded in isolation. Successful traders examine nearby support and resistance levels, overall market trends, trading volume, and confirmation from subsequent candles.
Because both patterns may appear near reversals, many chart readers initially confuse them. Yet their underlying psychology differs significantly. The hammer represents rejection of lower prices, while the doji reflects temporary equilibrium between buyers and sellers.
Hammer vs Doji Comparison Table
| Feature | Hammer | Doji |
|---|---|---|
| Classification | Bullish reversal pattern | Neutral pattern |
| Market message | Buyers regained control | Buyers and sellers are balanced |
| Body size | Small | Almost zero |
| Typical appearance | End of downtrend | Any market condition |
| Trading confidence | Higher with confirmation | Requires additional analysis |
| Reliability | Moderate with context | Depends heavily on context |
When Traders Mistake One for the Other
Most confusion occurs when traders encounter a Dragonfly Doji. Since it also has a long lower wick, it closely resembles a hammer. The deciding factor remains the candle’s body.
Another common mistake is labeling every candle with a long lower shadow as a hammer. A genuine hammer must appear after a meaningful downtrend. The identical candle shape occurring after an uptrend is called a Hanging Man, which carries a completely different interpretation. Context is just as important as shape.
How Professional Traders Use Both Patterns
Professional traders rarely rely on candlestick patterns alone. Instead, they combine them with:
- Support and resistance levels
- Volume analysis
- Trend direction
- Moving averages
- RSI
- MACD
- Fibonacci retracements
For example, a hammer forming at a long-term support level with rising trading volume carries much greater significance than one appearing randomly during sideways price action.
Likewise, a doji appearing after an extended rally may indicate fading momentum, but confirmation remains essential before taking action.
Common Trading Mistakes
Many beginners believe every hammer guarantees a bullish reversal. Markets are far more complex than that. A hammer simply tells us buyers responded aggressively during one trading period.
Similarly, many traders mistakenly treat every doji as an immediate reversal signal. In reality, a doji often leads to continuation rather than reversal, especially when strong trends remain intact.
The biggest mistake isn’t confusing a hammer with a doji—it’s ignoring the surrounding market context.
Best Confirmation Indicators
To improve accuracy, traders frequently combine hammer and doji patterns with:
- Volume analysis
- RSI divergence
- MACD crossovers
- Support and resistance zones
- Trendlines
- Moving averages
These tools help determine whether a candlestick pattern represents genuine institutional buying or simply temporary market noise.
Conclusion
The answer is straightforward: a hammer is not a doji.
While the two candlestick patterns may occasionally look alike—particularly when comparing a hammer with a Dragonfly Doji—they represent different market conditions. A hammer suggests buyers have successfully rejected lower prices after a decline and may signal a bullish reversal. A doji reflects uncertainty, showing that buyers and sellers finished the session in near-perfect balance.
Learning to distinguish these subtle differences can improve chart reading, reduce trading mistakes, and build stronger technical analysis skills. The most successful traders don’t focus solely on candle shapes; they combine candlestick patterns with trend analysis, volume, support and resistance, and confirmation from subsequent price action before making decisions.
FAQs
1. Is a hammer considered a doji?
No. A hammer has a small but visible body, while a doji has almost no body because the opening and closing prices are nearly equal.
2. Why do a hammer and Dragonfly Doji look similar?
Both have long lower shadows, but the Dragonfly Doji lacks a meaningful real body.
3. Which pattern is more bullish?
A hammer generally provides a stronger bullish reversal signal than a standard doji when confirmed by subsequent price action.
4. Can a doji become a hammer?
No. A completed candlestick is classified based on its final structure. A Dragonfly Doji may resemble a hammer but remains a doji.
5. Should traders rely only on hammer or doji patterns?
No. Both patterns work best when combined with confirmation indicators, market structure, trend analysis, and sound risk management.