Is a Hammer Candle Always Bullish? A hammer candlestick is one of the most recognized patterns in technical analysis. Many beginner traders are taught that a hammer automatically signals a buying opportunity. That belief, however, can be expensive.
While the hammer is traditionally considered a bullish reversal pattern, it is not always bullish. Its effectiveness depends on market context, confirmation, trading volume, trend strength, and nearby support or resistance levels. Professional traders rarely make decisions based on a single candlestick alone.
Understanding the Hammer Candlestick
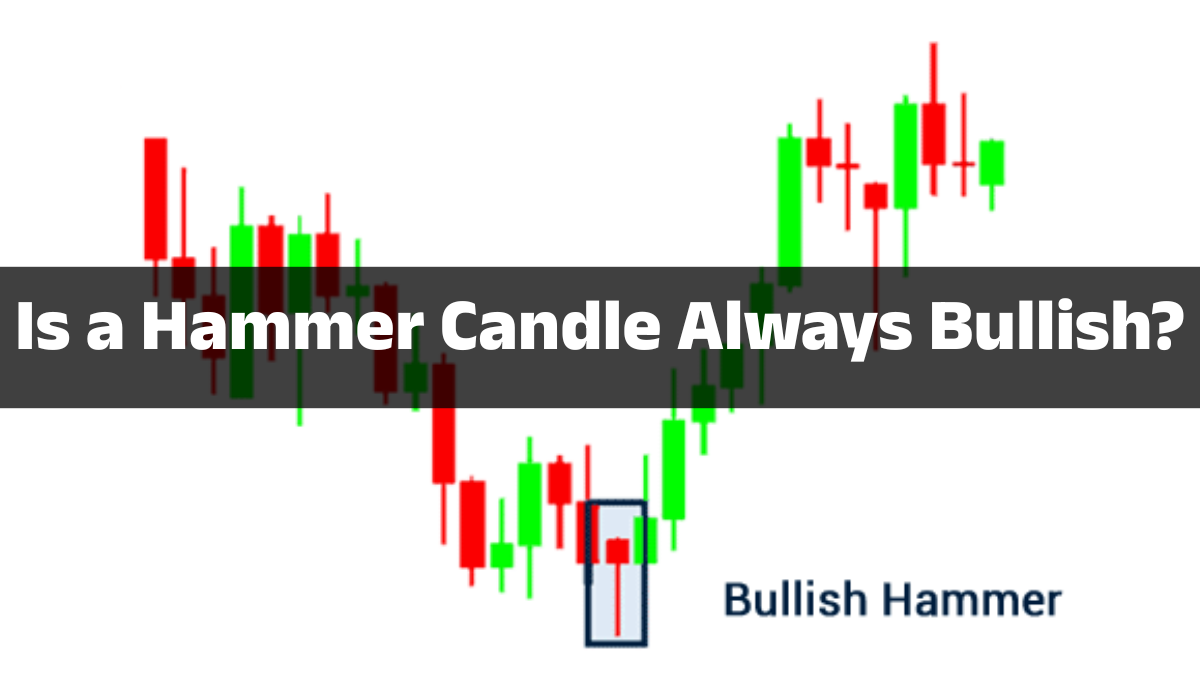
A hammer candlestick is identified by its distinctive appearance. It has a small real body near the top of the candle, a long lower shadow that is generally at least twice the size of the body, and little or no upper shadow. During the trading session, sellers initially dominate and push prices significantly lower. By the close, however, buyers regain control and drive the price back toward the opening level. This dramatic shift in momentum is what gives the hammer its reputation as a possible reversal signal.
The pattern reflects a battle between buyers and sellers rather than a guaranteed change in trend. Think of it like a tug-of-war where one team appears to be winning until the other team suddenly pulls back with surprising strength. The market is showing signs that bearish momentum may be weakening, but one candle alone cannot reveal whether buyers truly have lasting control.
Psychology Behind the Pattern
Every candlestick tells a story, and the hammer tells one of rejection. Sellers successfully forced prices downward, but buyers refused to accept those lower prices. They stepped in aggressively and erased most of the decline before the session ended. That shift suggests demand is emerging.
Market analyst Milan Cutkovic notes that traders generally wait for confirmation from the following candle before treating the hammer as a valid reversal signal. A close above the hammer’s high provides stronger evidence that buyers are indeed taking control.
Is a Hammer Always Bullish?
No. A hammer candle is not always bullish.
Although textbooks classify it as a bullish reversal pattern, real-world trading is more nuanced. The same candle shape may have completely different implications depending on where it appears on the chart. If it forms after a prolonged decline, it may indicate a potential reversal. If that identical candle appears after an uptrend, it is called a Hanging Man, which is considered a bearish warning instead.
Why Context Matters
Imagine seeing someone carrying an umbrella. Does that mean it’s raining? Not necessarily. They may simply be prepared for rain. A hammer works similarly. Its shape alone doesn’t tell the whole story.
Professional traders examine:
- Overall market trend
- Nearby support and resistance
- Trading volume
- Momentum indicators
- Confirmation candles
- Higher timeframe structure
Without those factors, the hammer is simply a candle with a long lower wick. Recent trading education from Capital.com emphasizes that without context, the candle is simply a shape, not a reliable trading signal.
When a Hammer Becomes a Strong Bullish Signal
After a Downtrend
The strongest hammer develops after a sustained decline. At this stage, sellers may be exhausted while bargain hunters begin entering the market. This combination often creates conditions for a short-term reversal.
At Major Support Levels
Support levels increase the significance of any reversal pattern. If a hammer appears exactly where buyers have historically entered the market, confidence improves considerably.
With High Trading Volume
Volume acts as confirmation. Heavy buying volume indicates institutional participation rather than random price movement. A hammer supported by rising volume generally carries greater credibility than one forming during thin trading.
| Factor | Weak Hammer | Strong Hammer |
|---|---|---|
| Trend | Sideways | Clear downtrend |
| Support | None | Major support level |
| Volume | Low | High |
| Confirmation | Missing | Bullish next candle |
| Probability | Lower | Higher |
When a Hammer Fails
During Strong Bear Markets
Strong downtrends often overwhelm individual candlestick patterns. A hammer may simply represent temporary profit-taking before sellers continue pushing prices lower.
Without Confirmation
One of the biggest mistakes beginners make is buying immediately after spotting a hammer.
Experienced traders generally wait for:
- The next candle to close above the hammer’s high.
- Increasing volume.
- Momentum indicators to align.
Without these confirmations, false signals become much more common.
Inside Sideways Markets
Markets moving sideways frequently produce long lower shadows without meaningful reversals. These hammers often reflect ordinary price fluctuations rather than genuine shifts in market sentiment.
Hammer vs Hanging Man
Similar Shape, Different Meaning
This is one of the most misunderstood concepts in technical analysis.
| Hammer | Hanging Man |
|---|---|
| Appears after a downtrend | Appears after an uptrend |
| Potential bullish reversal | Potential bearish reversal |
| Buyers reject lower prices | Buyers struggle to maintain higher prices |
| Look for bullish confirmation | Look for bearish confirmation |
The identical candle shape carries opposite meanings because location defines the pattern.
Confirmation Techniques
Price Action
The simplest confirmation is a bullish candle that closes above the hammer’s high. This demonstrates that buyers maintained control beyond the hammer session.
RSI, MACD, and Volume
Many professional traders combine the hammer with:
- RSI below 30 followed by a rebound
- MACD bullish crossover
- Volume spike
- Moving average support
- Trendline support
Using multiple confirmations reduces the likelihood of acting on false signals.
Trading Strategy
Entry, Stop Loss, and Target
A disciplined approach might look like this:
| Element | Example |
|---|---|
| Entry | Break above hammer high |
| Stop Loss | Below hammer low |
| Target | Next resistance level |
| Risk-Reward | Minimum 1:2 |
This structured plan helps remove emotion from trading decisions. Even strong setups can fail, so proper risk management remains essential.
Common Mistakes
Many traders lose money not because they misunderstand the hammer, but because they oversimplify it.
Common mistakes include:
- Buying immediately after the hammer forms.
- Ignoring the overall market trend.
- Trading against higher timeframes.
- Forgetting volume confirmation.
- Confusing a hammer with a hanging man.
- Risking too much on one trade.
Research and market education consistently emphasize that confirmation and context matter more than the candle itself.
Conclusion
A hammer candle is not always bullish. It is best viewed as an early warning that selling pressure may be fading, rather than a guarantee that prices will rise. The most reliable hammer patterns appear after established downtrends, at significant support levels, with above-average volume, and are confirmed by subsequent bullish price action.
Successful traders rarely rely on one candlestick. Instead, they combine the hammer with market structure, trend analysis, momentum indicators, and disciplined risk management. The hammer should be treated as one piece of evidence within a broader trading strategy—not as a standalone buy signal.
FAQs
1. Is a red hammer still bullish?
Yes. A red hammer can still be bullish because the candle’s shape and location are more important than its color.
2. What confirms a hammer candlestick?
A bullish candle closing above the hammer’s high, preferably with increased trading volume, provides the strongest confirmation.
3. Can a hammer appear in all markets?
Yes. Hammer candlesticks can be found in stocks, forex, cryptocurrencies, commodities, and indices across all timeframes.
4. What is the opposite of a hammer?
The bearish counterpart with the same shape appearing after an uptrend is called the Hanging Man.
5. Should traders rely only on hammer candles?
No. Most experienced traders combine hammer patterns with trend analysis, support and resistance, momentum indicators, volume, and sound risk management before entering a trade.